Key Takeaways
- Whatagraph describes tools for marketing reporting and data visualisation. Check its current features against your reporting needs.
- Compare alternatives on supported sources, report formats, automation, analysis, collaboration, and total cost.
- Alexia describes reporting and business insights across connected tools; confirm that the connectors and workflows you need are available.
- AI-generated summaries can support analysis, but figures and recommendations still need appropriate human review.
Whatagraph describes a marketing reporting platform for agencies and in-house teams. Its product information highlights visual reports, branded templates, and integrations that can help teams prepare recurring updates without assembling every report from scratch.
As reporting requirements grow, teams may want more than a dashboard. Clients may ask for explanations of campaign performance, opportunities to investigate, or recommendations for future activity. Marketers may still need to examine the data after report generation to provide that context.
This is one reason businesses compare Whatagraph alternatives. Report automation is only one part of the decision; teams should also review how each product supports analysis, who checks the output, and whether its connected sources match their requirements. Product features and prices can change, so check current information from each provider rather than relying on older comparisons.
What to Look for in a Marketing Reporting Platform
Choosing a replacement involves more than comparing dashboard layouts. A marketing reporting tool should connect to the platforms a team uses, support recurring reports, and make campaign results understandable across the channels included in the report.
Teams may also evaluate AI-generated summaries, KPI monitoring, recommendations, and the flexibility to explore questions beyond a static template. These features vary by product. Check supported sources, data fields, definitions, report schedules, branding, sharing, access controls, and pricing. A connector or AI feature does not guarantee that every metric can be combined or that the resulting analysis is suitable without review.
Popular Whatagraph Competitors
Several reporting platforms offer alternatives to Whatagraph depending on your reporting needs. A newer category also includes AI-assisted reporting products that aim to help teams explore data and prepare reports through questions, rather than relying only on existing templates. Compare their current features and data coverage before selecting a platform.
AgencyAnalytics
AgencyAnalytics focuses on agency reporting. Review its current white-label dashboards, client portal, and integration options.
Swydo
Swydo is an established agency reporting platform with marketing integrations and recurring report features. Compare its current source coverage and reporting workflow with your requirements.
Databox
Databox specialises in business dashboards and KPI reporting. Check whether its supported sources and visualisations fit your reporting process.
Looker Studio
Looker Studio supports report and dashboard creation and may suit organisations working primarily with Google's ecosystem. Verify the connectors and any third-party services needed to access other data.
Put these ideas to work
See how the workflows covered in this article run inside the Teamified platform.
Bring Your Marketing Channels Together
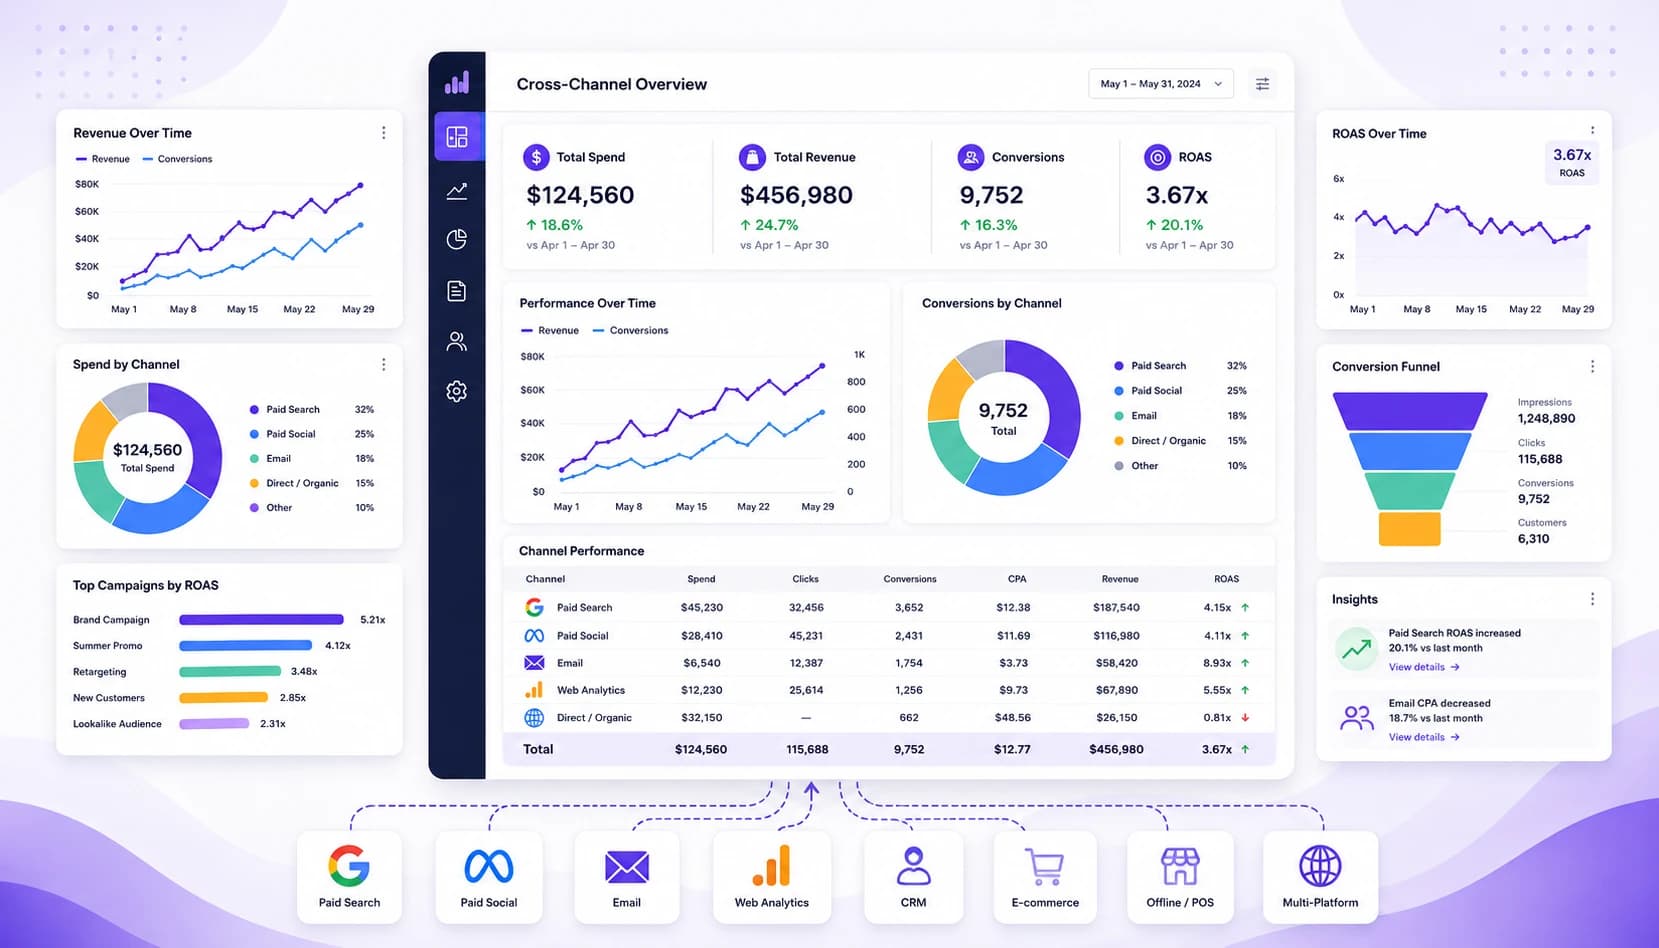
Before choosing a reporting platform, list the campaign and CRM sources you need in a report. Check that the required data can be connected and compared using consistent definitions.
Alexia: An AI-Powered Alternative to Whatagraph
Alexia describes reporting as part of a broader AI workspace. After connecting supported tools, a user can ask a reporting question such as "How did our marketing perform this month?", "Which campaigns generated the strongest return?", or "Why did conversions decline last week?" The information available depends on connected sources, account permissions, and the data behind those questions.
See the reporting use cases and check the integration directory for supported connections. Before relying on an analysis, verify the source data and metric definitions, and have someone familiar with the campaign review generated commentary.
Whatagraph vs Alexia
Whatagraph product materials describe visual dashboards and report templates. Alexia describes an AI-assisted, conversational reporting approach within a broader workspace. These are high-level descriptions, not a complete feature comparison; available plans, integrations, and reporting details can change.
| Feature to assess | Whatagraph | Alexia |
|---|---|---|
| Report creation | Review templates, dashboards, and output formats | Review report generation and conversational workflows |
| Analysis | Confirm available summaries and analysis features | Confirm what connected sources support and how outputs are checked |
| Cross-platform reporting | Verify supported sources and available combined metrics | Verify supported integrations, fields, and data coverage |
| Maintenance | Check template, connector, and account administration | Check integration setup, access, and review responsibilities |
| Flexibility | Test how reports adapt to different clients and questions | Test how the workspace handles your reporting questions |
Use the same reporting question and data period when testing alternatives to make the comparison meaningful.
AI Reporting Creates More Valuable Client Reports
Clients rarely ask agencies for more charts alone. They may ask why lead quality changed, which campaigns warrant closer review, whether marketing spend is associated with profitable growth, or how performance compares with previous months. Answering these questions can require looking across several sources and checking how the metrics were defined.
AI-assisted reporting may shorten parts of that process by helping identify trends, highlight changes, or prepare first-draft insights from connected data. The result is only a starting point: marketing teams remain responsible for strategy and client communication. Check figures against source systems, explain assumptions, and do not present a generated recommendation as established fact without review.
Choosing the Right Reporting Platform
Whatagraph may suit businesses that value visual dashboards and recurring report templates. Teams seeking deeper analysis, different reporting workflows, or AI-assisted insights can compare other approaches, including Alexia. Alexia's product materials describe reporting and connected data features, but each workflow depends on the integrations and data available.
Shortlist the requirements that matter most, verify current product documentation, and trial a representative report. Compare accuracy, review effort, output quality, implementation, and total cost before deciding. Connect only the marketing platforms you need for the test, and check the result against your current reporting workflow.
Turn Cross-Channel Data into One Useful Report
Review Alexia's reporting features and supported integrations to assess whether connected marketing information can support the business questions your team needs to answer.

About the Author
Simon Jones
Co-Founder, Teamified
Simon Jones is the co-founder and CTO of Teamified, bringing decades of experience in technology, system architecture, and business transformation. He oversees the technical direction of Alexia.ai, ensuring the platform delivers enterprise-grade automation and intelligence.
Connect on LinkedInEvaluate your marketing reporting workflow
Review Alexia's reporting features and supported integrations, then test whether they fit your needs.