Key Takeaways
- Dashboards remain useful for recurring KPIs, operational monitoring and shared performance views.
- Conversational AI can help with ad hoc questions and follow-up analysis, subject to connected data and validation.
- Tableau, Power BI and Databox offer dashboard products with AI-related capabilities.
- Looker Studio is an option for flexible visual reporting, while Geckoboard focuses on visible KPI displays.
- Alexia describes connected reporting with conversational analysis and saved reports that refresh automatically.
- Many teams can use dashboards for monitoring and AI-assisted analysis for questions that change.
A dashboard used to be the default answer whenever a business needed better visibility. Connect the data, choose the metrics, build the charts and give everyone a place to monitor performance. That model still works.
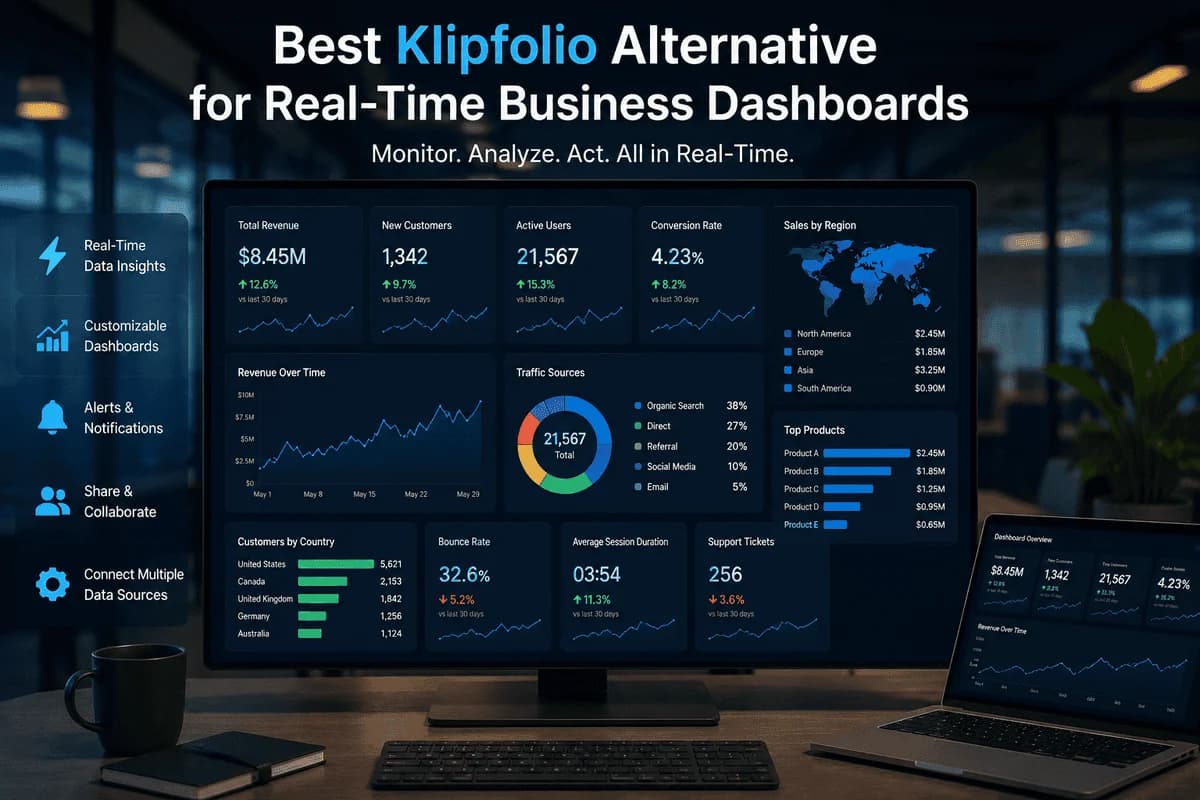
What has changed is how people interact with business data. Business dashboard tools increasingly combine persistent visualisations with natural-language analysis, AI-generated summaries and conversational questions. The decision is therefore less about dashboards versus AI and more about choosing the right interface for the question.
Some metrics need to stay visible every day. Other questions arise once and may be easier to investigate through conversation than by building another dashboard. This guide compares six approaches to help you choose the best dashboard software for your business.
Business dashboard tools at a glance
| Platform | Best for | Main strength |
|---|---|---|
| Tableau | Advanced BI and visual analytics | Customisation and analytics |
| Power BI | Microsoft-based organisations | BI within Microsoft's ecosystem |
| Looker Studio | Flexible visual reporting | Accessible dashboards |
| Databox | KPI monitoring and analysis | Dashboards with its Genie assistant |
| Geckoboard | Visible KPI displays | Team and TV dashboards |
| Alexia | Cross-business reporting | Connected reports and conversational analysis |
Tableau focuses on visual analytics and business intelligence. Power BI provides reporting and modelling within Microsoft's ecosystem. Looker Studio supports visual reporting. Databox combines performance dashboards with its Genie assistant. Geckoboard focuses on visible KPI dashboards. Alexia describes connected reporting that can be explored through conversational requests.
The products serve different needs. Check each vendor's current features, integration support, access controls and pricing before deciding.
Best business dashboard software in 2026
The right choice depends on who builds reports, how complex the data is and how people need to use the results.
1. Tableau
Tableau is an option for organisations that need sophisticated visualisation, data exploration and governed analytics. Tableau's Agent page describes ways to explore data using natural language and to create visualisations and calculations with AI assistance. Tableau documentation also covers dashboard narratives; check the applicable product, version and configuration before relying on a feature.
Best for: Organisations with data or analytics teams that need detailed customisation and governance.
Consideration: Smaller teams may not need the depth or administration that comes with an enterprise BI environment.
2. Power BI
Power BI is a natural option for businesses already working with Microsoft products. It combines interactive dashboards, semantic models and enterprise analytics. Microsoft's Copilot documentation describes assistance for supported users, including conversational work with data. Copilot access depends on eligible licensing and capacity, so confirm requirements with Microsoft.
Best for: Microsoft-centric organisations and teams that need structured BI.
Consideration: Advanced modelling and dashboard development can still require specialist knowledge.
3. Looker Studio
Looker Studio is Google's visual reporting tool for creating interactive dashboards from Google and third-party data sources. Google maintains current information about the product and its connectors; check that documentation for source availability rather than relying on a connector count or product-name change claim.
Best for: Teams that want flexible dashboards without purchasing dedicated BI software.
Consideration: Complex cross-platform modelling may require additional connectors or data preparation.
4. Databox
Databox combines traditional dashboarding with conversational business analysis. Its documentation describes Genie, an AI analyst that can answer questions about connected performance data in plain language and generate insights. Review the current product information to confirm the sources, metrics and plan features your team needs.
This illustrates how the distinction between dashboard tools and AI reporting is changing, although an AI analyst still depends on the connected data and the question asked.
Best for: Growth, marketing and business teams that want dashboards alongside conversational analysis.
Consideration: Check how data sources, users and AI usage fit the plan and workflow you require.
5. Geckoboard
Geckoboard takes a simpler approach focused on putting important metrics in front of teams through dashboards, shared links and TV displays. Its pricing page lists current plans and features, which can change over time.
Best for: Sales floors, customer-support teams and operational environments where a small set of metrics needs to remain visible.
Consideration: Teams looking for deeper exploratory analytics may also need a broader BI platform.
6. Alexia: for questions that extend beyond a dashboard
Alexia approaches business reporting from both sides. Teams can create saved reports using connected business data and have them refresh automatically. Its integrations page lists supported connections, and the built-in tools page describes saved reports that refresh automatically. Confirm source support, account permissions and scheduling options for your workflow.
Users can also explore connected data conversationally. Instead of creating another dashboard when a new question appears, a user might ask “Why did revenue fall this month?” or “Which marketing channel generated the strongest sales pipeline this quarter?” The second question may require information across advertising platforms, CRM and finance or operations. Answers depend on supported sources, permissions, definitions and review of the resulting analysis.
Best for: Businesses that want recurring reports and dashboards alongside conversational, cross-system analysis.
Consideration: Organisations requiring highly specialised enterprise visualisation or complex semantic modelling may still prefer dedicated BI software.
Dashboards vs AI reporting: when should you use each?
The two approaches serve different purposes.
Use a dashboard when
A dashboard is useful when the same KPIs need continuous monitoring, multiple people need a standardised view, performance should remain visible on a screen or TV, executives expect a consistent scorecard or operational teams need rapid visual signals.
A sales team, for example, may always want pipeline, revenue and quota attainment displayed in a consistent format. A dashboard keeps that view available without having to restate the question each time.
Use conversational AI when
Conversational analysis can be useful when questions change frequently, someone wants to understand why a metric moved, analysis needs to cross multiple systems, a leader has an unexpected follow-up question or building another dashboard would create unnecessary work.
A dashboard might show that marketing-generated pipeline declined. The next question could be: “Which campaigns caused the decline, and was it due to fewer leads or lower conversion into opportunities?” That type of exploratory follow-up is where conversational analysis can be useful. The answer depends on available sources and attribution rules, and should be checked against the underlying data.
What to look for in business dashboard tools
Before choosing software, test the platform against your actual reporting needs.
Data connections
Can the product connect with the systems that contain important business information? Check the specific services, permissions and data fields, rather than relying on a headline integration count.
Put these ideas to work
See how the workflows covered in this article run inside the Teamified platform.
Metric consistency
Can teams maintain consistent definitions for KPIs across reports? Agree on formulas, filters and reporting periods, then confirm how those rules are applied.
Dashboard customisation
How much control do you need over layouts, charts and branding? Match the platform's customisation options to the reports your audiences actually use.
AI analysis
Can users ask follow-up questions without building another view? Check how answers are grounded in connected data and whether users can inspect the underlying figures.
Automatic refreshing
Will dashboards and saved reports update without manual exports? Verify refresh frequency, source limitations and any configuration required.
Sharing
Can information be distributed through links, email, screens or scheduled reports in a way that fits the team's workflow?
Governance
Can administrators control access to sensitive financial, customer or employee information? The best business dashboard software should make information easier to use, rather than creating another reporting system that requires constant maintenance.
Data connections
Can the product connect to the systems that contain important business information? Check the specific connector, permissions and data fields, not just the size of a vendor's integration list.
Metric consistency
Can teams use consistent definitions for KPIs across reports? Determine how calculations, filters and comparison periods are set and reviewed.
Customisation and AI analysis
How much control do you need over layouts, charts and branding? Can users ask follow-up questions without building a new view, and can they check the evidence behind the answer?
Refreshing, sharing and governance
Find out how dashboards and saved reports refresh, how information is shared and what access controls are available. Administrators should be able to protect sensitive financial, customer and employee information.
Do AI reporting tools replace dashboards?
For most businesses, probably not. Persistent dashboards remain extremely useful when a metric deserves continuous attention. AI can reduce the need to build a new dashboard for every question.
A practical reporting setup can use dashboards for monitoring, AI for investigation and scheduled reports for communication. Some platforms are combining these approaches. Tableau documentation describes AI-assisted ways to work with data; Power BI offers Copilot in supported scenarios; and Databox combines dashboards with Genie. Alexia describes a similar shift toward interactive reporting, alongside meetings, tasks and connected business tools. Compare current product capabilities and availability with your organisation's requirements.
Build fewer dashboards and get more answers
The dashboard is not disappearing. Its role is becoming clearer. Use dashboards for measures your business needs to see repeatedly. Use conversational analysis when someone needs to explore what changed, understand why it happened or connect information across systems.
Alexia's product information describes recurring report visibility alongside conversational analysis. Saved reports can refresh automatically, while connected business data can support questions across marketing, CRM, finance and operations when the relevant sources are supported. The objective is not to eliminate dashboards. It is to stop building one every time someone asks a new question.

About the Author
Simon Jones
Co-Founder, Teamified
Simon Jones is the co-founder and CTO of Teamified, bringing decades of experience in technology, system architecture, and business transformation. He oversees the technical direction of Alexia.ai, ensuring the platform delivers enterprise-grade automation and intelligence.
Connect on LinkedInAdd conversation to your reporting
Explore Alexia's connected reporting approach and verify that your sources and workflow are supported.